The cover ratio ladder: sizing, lock-up and default DSCR explained
By SolarQuant Editorial. Published 2026-10-05. Last updated 2026-10-05.
A solar project finance term sheet sets three debt service cover ratio (DSCR) levels, not one. Debt is sized at the highest, distributions to shareholders stop below the middle one, and lenders can enforce below the lowest. The gaps between them decide how much underperformance a project can absorb before its owners lose their cash, and then control.
What is the cover ratio ladder?
The cover ratio ladder is the set of DSCR thresholds in a loan, ordered from the level at which debt is sized down to the level at which lenders can enforce. DSCR is cash flow available for debt service (CFADS) divided by debt service, so each step down means less cash left over after the lenders are paid.
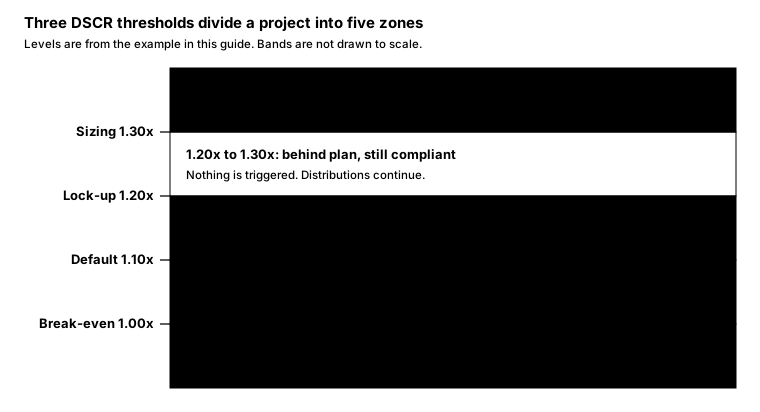
Read it from the top. A project starts in the top zone and moves down only when cash flow underperforms. Shareholders feel the first threshold that matters to them at 1.20x. Lenders gain their remedies at 1.10x, while the project still earns more than its debt service.
What does each threshold do?
The sizing ratio is the DSCR at which the lender sizes the debt. The lock-up and default ratios are covenants, tested on set dates for the life of the loan.
| Threshold | Level in the example | What it is for | What happens when DSCR falls below it |
|---|---|---|---|
| Sizing ratio | 1.30x | Sets the most debt the lender's case can service | Nothing is triggered. The project is behind plan but compliant |
| Lock-up ratio | 1.20x | An early warning that keeps cash inside the project | Distributions to shareholders are suspended until the ratio recovers |
| Default ratio | 1.10x | Gives lenders control before a payment is missed | An event of default. Lenders can demand repayment or take control of the project |
| Break-even | 1.00x | Not a covenant, only the arithmetic floor | CFADS no longer covers debt service, so reserves are drawn |
Forvis Mazars says the lock-up level is set lower than the structuring-phase target, and that default is triggered at an even lower DSCR threshold. The APMG PPP Guide describes the same two values and notes that the thresholds depend on the market conditions of each country and sector. There is no universal set of numbers. The levels here belong to this guide's invented example.
Why do the three levels sit apart?
Each gap protects a different party, and each gives time for a different response. A single threshold would force lenders to choose between acting too early and acting too late.
- Sizing to lock-up: the shareholders' buffer. Output and costs vary from year to year. This gap lets a project have an ordinary weak year without losing its distributions.
- Lock-up to default: the repair zone. Debt service is still paid in full, but spare cash stays in the project. Forvis Mazars describes this as preserving cash within the project during periods of weak performance. The trapped cash builds a cushion while the sponsors fix the cause.
- Default to break-even: the lenders' buffer. Lenders gain their remedies while the project can still cover its debt service. They do not have to wait for a missed payment.
The width of each gap is negotiable, and it matters as much as the levels. A sponsor wants a wide first gap. A lender wants the second gap wide enough for trapped cash to make a difference.
How far can cash flow fall before each threshold?
Headroom is the fall in CFADS a project can take before it crosses a threshold. It follows directly from the ratio levels: from a 1.30x sizing ratio, lock-up at 1.20x is reached when CFADS falls by 1 minus 1.20 divided by 1.30, which is 7.7%.
| Threshold | DSCR | Year 1 CFADS (USD m) | Fall in CFADS | Equivalent fall in revenue |
|---|---|---|---|---|
| Sizing | 1.30x | 4.20 | 0% | 0% |
| Lock-up | 1.20x | 3.88 | 7.7% | 5.8% |
| Default | 1.10x | 3.55 | 15.4% | 11.5% |
| Break-even | 1.00x | 3.23 | 23.1% | 17.3% |
The revenue column assumes year 1 revenue of USD 5.6m, with operating costs and tax fixed at USD 1.4m. Fixed costs make CFADS fall faster than revenue, which is why a 5.8% revenue shortfall is enough to stop distributions. In practice tax would fall slightly with revenue.
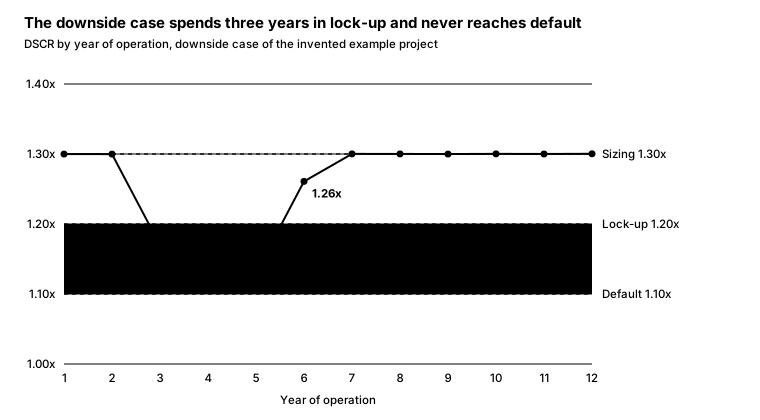
The chart applies a downside case to the example. CFADS runs 10%, 12% and 13% under the lender's case in years 3 to 5, then 3% under in year 6. DSCR stays in the lock-up zone for three years and recovers without touching the default level.
What happens to shareholders' cash in lock-up?
A lock-up delays distributions. It does not cancel them. Cash that would have been paid out is held in the project company and released once the tests are passed again.
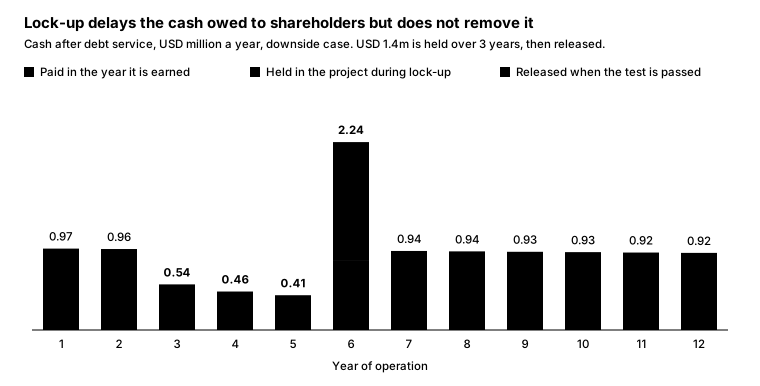
In the downside case the project fails the 1.20x test in years 3, 4 and 5. Debt service is paid in full in each of those years. The cash left over stays in the project and is released in year 6, together with that year's own surplus.
The effect on returns is smaller than it looks. Over a 20-year project life, equity IRR in the downside case is about 0.8 percentage points below the base case. About 0.7 points come from the lost cash flow itself, and only about 0.1 from the delay the lock-up causes.
The real risk is a lock-up that does not end. Trapped cash then sits in the project as extra protection for lenders and earns the sponsor nothing. Check whether the term sheet lets lenders apply long-trapped cash to prepay the loan.
How are the ratios tested?
A covenant ratio is only as clear as its test: which cash flows, over which period, on which date. The term sheet's ratio definitions answer all three, and the model must follow them exactly.
| Question | What to look for | Effect on the model |
|---|---|---|
| Past or future cash flows? | Forvis Mazars notes that lenders typically assess DSCR on both a 12-month look-back and a 12-month look-forward basis | The historic test needs actual results. The forward test needs the forecast re-run at each test date |
| How often? | The calculation dates, often tied to repayment dates | One test flag per calculation date |
| Senior or total debt? | With subordinated debt there are often two ladders: senior debt service only, and all debt service | Two DSCR rows, each with its own thresholds |
| DSCR only, or LLCR too? | Many term sheets set lock-up and default levels for the loan life cover ratio as well | A second set of tests on the present value of future CFADS |
| Ratio only? | Distributions usually also require no default and fully funded reserves | The lock-up flag combines every condition, not only the ratio |
The two ratios catch different problems. DSCR flags one weak period. LLCR flags a forecast that has weakened over the rest of the loan, even if the current period still passes.
Can sponsors fix a breach with new equity?
Sometimes. An equity cure lets a sponsor inject capital to remedy a financial covenant breach so that it does not become an event of default. Whether a project facility allows a cure, and how the money is counted, is in our reading negotiated deal by deal.
Simmons & Simmons describes the mechanism and its usual limits in European leveraged loans, such as a cap on the number of cures. Arthur Cox notes that borrowers in project and real estate financings often seek equity cure rights to gain breathing space.
Why do some term sheets raise the ratios after the early years?
Some term sheets set each threshold at one level for the first years of operation and a higher level afterwards. Public sources say little about why, so the reasoning below is our own reading.
- Early tolerance. A new plant has teething problems: commissioning defects, curtailment, a slow first billing cycle. Lower early thresholds stop these from triggering a lock-up on a sound project.
- Less time to recover later. As the loan shortens, fewer years of cash flow remain to make good a shortfall. A higher threshold flags trouble sooner.
For the modeller the consequence is simple. A threshold is a row of inputs across time, not a single cell.
How do you model the ladder?
The ladder needs three things in a model: thresholds as inputs, flags that test them, and a distribution account that obeys the flags.
- Enter each threshold as a row across time on the inputs sheet, one row per ratio and per level.
- Calculate CFADS exactly as the term sheet defines it.
- Calculate each ratio on each calculation date, on the basis required: historic, forward-looking or both.
- Build a lock-up flag that is 1 when any tested ratio is below its lock-up level or any other distribution condition fails.
- Send cash left after debt service and reserves to a distribution account. Pay it out only when the flag is 0. Otherwise carry the balance forward.
- Build a default flag. Do not model enforcement. Report the period and the ratio that breached.
- Report headroom: the fall in CFADS, and in revenue, that would trigger lock-up and default in the tightest period.
- Run downside cases and record which threshold each one reaches.
What are the common mistakes?
Most errors come from treating the three ratios as one, or from testing them only in the case where they cannot fail.
- Treating the sizing ratio as a covenant. Falling below 1.30x in the example triggers nothing. The covenants are the two lower levels.
- Testing only the base case. With sculpted debt the base case DSCR equals the sizing ratio in every period by construction. The ladder only shows up in downside cases and in actual results.
- Paying out trapped cash at once. Cash caught by a lock-up is released when the test is next passed, not when it is earned. Equity cash flows must follow the release date.
- Counting trapped cash in CFADS. Cash balances and reserve balances are not cash flow. Including them inflates the next period's ratio.
- One cell per threshold. Stepped thresholds need a value for every period.
- Ratio-only lock-up flags. A project can pass the ratio and still be barred from distributing, for example when a reserve is under-funded.
Frequently asked questions
What is a typical lock-up DSCR for a solar project?
There is no single figure. The APMG PPP Guide notes that thresholds depend on the market conditions of each country and sector. Forvis Mazars says a project with contracted revenue and a strong counterparty might be sized to around 1.20x to 1.35x, with lock-up set lower. This guide's example uses 1.20x under a 1.30x sizing ratio.
Is a lock-up an event of default?
No. A lock-up only stops distributions to shareholders. The loan stays in good standing and the lenders have no right to enforce. Default is a separate, lower threshold.
Does a lock-up stop debt payments?
No. Interest and principal are paid as scheduled, and reserve accounts are topped up as usual. Only the cash that would have gone to shareholders is held.
How much can revenue fall before a lock-up?
It depends on the gap between the sizing and lock-up ratios and on the project's fixed costs. In this guide's example, a 5.8% fall in revenue takes DSCR from 1.30x to 1.20x.
What happens to the cash trapped in a lock-up?
It stays in the project company's accounts. It is released to shareholders when the lock-up tests are passed again. Until then it is extra protection for lenders.
Sources
Pages opened on 4 October 2026 and checked again on 5 October 2026. The example project is invented and has no source.
- Debt Service Coverage Ratio (DSCR): formula, meaning and use in project finance, Forvis Mazars. Lock-up and default mechanics, trapped cash, look-back and look-forward tests, sizing ratios.
- 8.1 Measuring Commercial Feasibility, APMG PPP Certification Guide. Lock-up and default values, thresholds that depend on country and sector, LLCR.
- Loan Life Cover Ratio: A First Principles Explanation, Operis, August 2018. LLCR.
- Key Considerations for Equity Cures, Simmons & Simmons, August 2015. Equity cure definition and limits in European leveraged loans.
- Arc Of The (Financial) Covenant: Issues For Project And Real Estate Finance, Arthur Cox, published on Mondaq, May 2021. Equity cure rights in project and real estate financings.