Debt sizing for solar projects: gearing cap versus DSCR sculpting
By SolarQuant Editorial. Published 2026-10-05. Last updated 2026-10-05.
A solar term sheet limits debt twice: by a gearing cap and by a cover ratio. The model computes both amounts and takes the lower one. In our invented 40 MWp example the cap allows USD 28.0m, the cover ratio allows USD 25.1m, and the cover ratio binds.
What limits the debt on a solar term sheet?
A term sheet limits senior debt with two separate tests, and the facility is the lower of the two results. The gearing cap limits debt as a share of the total funding requirement. The cover ratio limits debt to what the lender's case cash flow can service with a set margin.
| Test | What the term sheet typically says | Input it depends on | Result in the example (invented) |
|---|---|---|---|
| Gearing cap | Debt may not exceed 70% of the total funding requirement | Project cost, including financing costs | USD 28.0m |
| Cover ratio | Debt is sized so that the lender's case DSCR is at least 1.30x in every period | CFADS, tenor, interest rate, target ratio | USD 25.1m |
| Facility amount | The lower of the two | Both | USD 25.1m |
The pillar article, How to read a solar project finance term sheet: a modeller's guide, shows where these clauses sit. This article shows how to calculate each limit.
What is a gearing cap and how is it calculated?
A gearing cap is the largest share of the total funding requirement that senior debt may finance. A 70:30 cap means equity or shareholder loans fund at least 30%.
Here g is the cap and F is the total funding requirement. In the example F is USD 40.0m and g is 70%, so the cap allows USD 28.0m.
The cap makes the sponsor carry the first loss. Edward Bodmer calls this the "skin in the game" philosophy, as opposed to "believing a forecast". The IFC developer's guide describes solar project financing as typically at least 30 percent equity, with the remainder as debt.
The common mistake is to apply the cap to construction cost alone. Check the definition in the term sheet. In our reading the base is usually the full funding requirement, including fees, interest during construction and reserves funded at close.
How does DSCR-based debt sizing work?
DSCR-based sizing sets debt service in each period equal to CFADS divided by the target ratio. It then discounts that debt service at the loan's interest rate. The present value is the most debt the cash flow can repay within the tenor.
Forvis Mazars gives the same rule from the principal side: principal equals CFADS divided by the DSCR, less interest. The Renewables Valuation Institute describes it as dividing each quarter's CFADS by the target DSCR.
In the example, year 1 CFADS is USD 4.2m and the sizing ratio is 1.30x, so year 1 debt service is USD 3.231m. Twelve years of such payments, discounted at 7.0%, give USD 25.07m of debt. The example uses annual periods, while Forvis Mazars notes that a debt service period is typically a quarter or a half-year.
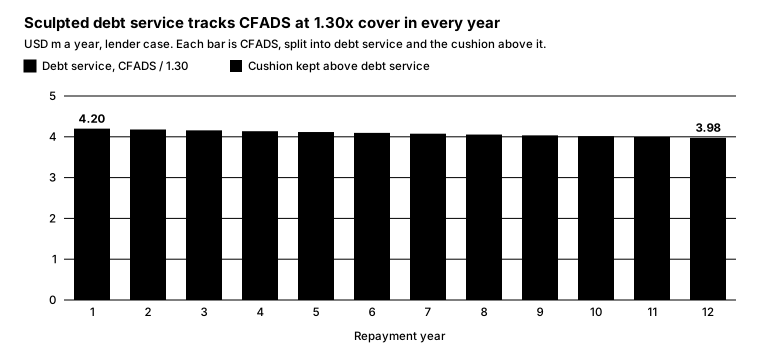
Debt service falls in step with CFADS, so the ratio holds at 1.30x in every year. The grey cushion, USD 0.97m in year 1, protects the lender and funds distributions.
The discounting works because a loan balance equals the present value of its remaining debt service at the loan rate. If the rate changes over the tenor, discount each period at its own rate.
Which limit binds, and why?
The limit that gives the lower debt amount binds. In the example the DSCR limit is USD 25.1m, or 62.7% gearing, and the gearing cap is USD 28.0m. The DSCR binds and the cap has USD 2.9m of unused room.
A quick test is the break-even ratio. The present value of the 12 years of lender's case CFADS at 7.0% is USD 32.6m. Divide it by the USD 28.0m cap and you get 1.16x: at any sizing ratio above that, the DSCR binds.
Edward Bodmer lists what tilts the outcome. The debt to capital limit tends to bind with a higher project IRR, a longer tenor, lower interest rates, a lower DSCR and lower taxes. On his related page, a shorter tenor or a higher interest rate makes the DSCR more likely to bind.
How do tenor, interest rate and target DSCR move debt capacity?
Debt capacity rises with a longer tenor, a lower interest rate and a lower target ratio. The chart reruns the example nine times, changing one term at a time and holding CFADS fixed.
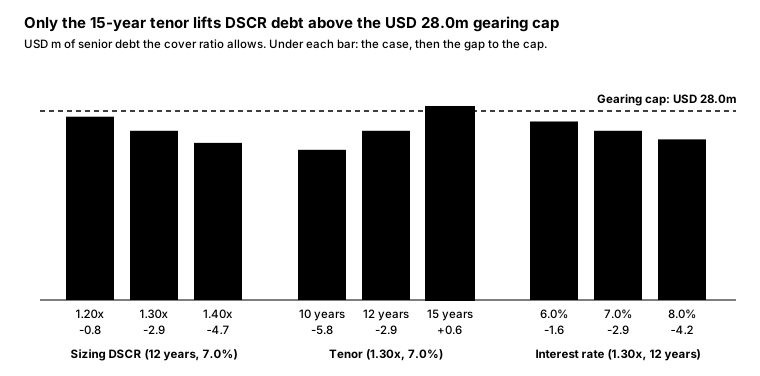
Tenor moves the result most. Three more years add USD 3.5m and lift the DSCR amount above the cap, so the cap becomes the binding limit. One point of interest moves capacity by about USD 1.3m, and 0.10x of ratio by about USD 2m.
Each case compares against the same USD 28.0m cap, which a full model would recompute (see the sizing loop below).
Sculpting, annuity or equal principal: which repayment profile?
Sculpting shapes debt service to follow CFADS, an annuity keeps debt service level, and equal principal repays the same principal each period. For a given minimum DSCR, sculpting supports the most debt because no period carries spare cover.
The table applies each profile to the example over 12 years at 7.0%. The DSCR and interest columns use the same USD 25.07m loan.
| Profile | Debt service, year 1 (USD m) | Debt service, year 12 (USD m) | DSCR, year 1 | DSCR, year 12 | Total interest (USD m) | Most debt with DSCR of 1.30x or more every year (USD m) |
|---|---|---|---|---|---|---|
| Sculpted to 1.30x | 3.231 | 3.057 | 1.30x | 1.30x | 12.65 | 25.07 |
| Level annuity | 3.156 | 3.156 | 1.33x | 1.26x | 12.80 | 24.28 |
| Equal principal | 3.844 | 2.235 | 1.09x | 1.78x | 11.41 | 21.07 |
The annuity drops below 1.30x from year 6, because CFADS degrades while debt service stays flat. Equal principal starts at 1.09x, under the 1.10x default level, and would support only USD 21.07m.
Forvis Mazars makes the same point: matching debt service to CFADS improves the project's debt carrying capacity. It also stresses that sizing and sculpting go together but are different exercises.
Why do lenders size on P90 while equity looks at P50?
Lenders size debt on a conservative yield case because their return is capped. A good solar year pays them no more than an average one. Equity keeps the upside, so in our reading it values the project on the expected case.
P50 and P90 are exceedance probabilities. P50 is the yield expected to be exceeded in half of all years, and P90 in nine years out of ten. An NREL paper says competitive financing requires the risk from year-to-year solar resource variability to be quantified.
Practice on which case to pair with which ratio varies, so read the term sheet. The IFC developer's guide says investors will most often require a P90 energy yield.
The Renewables Valuation Institute says P50 is typically used to size debt, and some lenders add a P99 test at a lower ratio. Its general examples are 1.30x on P50 and 1.00x on P99, and its case study uses 1.20x and 1.00x. Each case gives its own debt amount, and the lower one binds.
Bodmer explains the lower ratio on a P90 or P99 case, writing about wind farms. That case is like a downside case, so the project is already in the buffer.
In the example, assume the USD 4.2m lender's case is the P90 case and the P50 case gives USD 4.6m in year 1 (invented). The same debt service then shows a 1.42x DSCR on P50. If the term sheet also required 1.45x on P50 (invented), that test would allow USD 24.6m and would bind instead.
For the model, this means two CFADS lines. The lender's case drives debt sizing, and the P50 case drives the equity return.
Why is debt sizing circular, and how do you solve it?
Debt sizing is circular because the debt amount sets the fees and the interest during construction. Those costs are part of the funding requirement, and the funding requirement sets the gearing cap. A reserve account funded at close adds a second loop, since it depends on debt service.
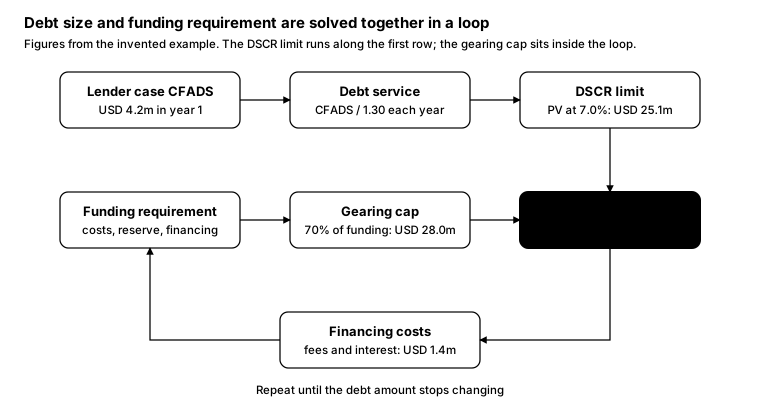
The DSCR limit sits outside the loop, because it depends on CFADS and not on cost. The gearing cap sits inside it.
In the example, the funding requirement before financing costs is USD 38.6m, which includes the USD 1.62m cash-funded DSRA. Financing costs during construction are about 5.6% of the debt. That is the 1.5% upfront fee, plus the 1.2% commitment fee and 7.0% interest on a half-drawn loan, ignoring the agency fee.
With the DSCR binding, the loop settles in two passes. Debt is USD 25.07m whatever the cost, financing costs are USD 1.4m, and the funding requirement is USD 40.0m.
If the cap bound instead, debt and cost would chase each other. A sizing ratio of 1.15x would allow USD 28.3m on cover, so the cap would bind. The fixed point can be solved directly: C is the funding requirement before financing costs and k the financing cost per dollar of debt.
Debt would be USD 28.12m and the funding requirement USD 40.17m. This holds the DSRA at USD 1.62m for simplicity.
There are three ways to solve the loop: spreadsheet iteration, a copy and paste macro, or algebra like this. The Renewables Valuation Institute suggests a VBA macro for the iterative sculpting process. In our reading, a macro or a closed form is easier to audit than live circular references.
What does the binding constraint mean for equity?
The binding constraint tells the sponsor which lever raises debt. When the DSCR binds, only better lender's case cash flow or softer debt terms add debt. When the gearing cap binds, only a higher cap or a larger funding base does.
In the example the DSCR binds, so equity is USD 14.9m. The cap alone would have implied USD 12.0m. Any cost overrun before close is paid in full by equity, because the debt amount does not move with cost.
Cash flow is the lever that works. Each extra USD 0.1m of annual lender's case CFADS, degrading like the rest, adds about USD 0.6m of debt.
Bodmer notes the opposite incentive under a debt to capital limit. Sponsors then gain from adding non-cash items such as development fees to project cost. With the DSCR binding, that brings no extra debt.
Sizing is only the start of the ratio's work. The cover ratio ladder article follows the same DSCR down to the 1.20x lock-up and 1.10x default levels.
How do you model it?
Model debt sizing as two parallel calculations and one minimum, wrapped in a loop. The steps below use the example figures.
- Build the lender's case CFADS for every period of the tenor, on the yield case the term sheet names. Year 1 is USD 4.2m.
- Divide each period's CFADS by the sizing ratio of 1.30x to get the sculpted debt service. Year 1 is USD 3.231m.
- Discount the debt service at the all-in rate of 7.0%. The sum is the DSCR limit: USD 25.07m.
- Build the funding requirement for a trial debt amount: costs before financing, plus fees, interest during construction and funded reserves.
- Multiply the funding requirement by the 70% cap to get the gearing limit.
- Set the debt amount to the lower of steps 3 and 5. Feed it back into step 4 and repeat until it stops changing.
- Build the repayment schedule. Principal is debt service less interest, and the closing balance must reach zero in the final period.
- Add checks: minimum DSCR equals the sizing ratio, gearing is at or under the cap, and sources equal uses. Show which limit binds.
- Hold the debt fixed and run the equity return on the P50 case.
What are the common mistakes?
Most debt sizing errors come from using the wrong input in an otherwise correct formula. These are the ones we would check first.
- Sizing on the wrong case. Sizing at 1.30x on the invented P50 CFADS of USD 4.6m gives USD 27.5m, which is USD 2.4m more than the lender's case supports.
- Treating the gearing cap as the debt amount. A model that shows USD 28.0m when cover allows USD 25.1m hides a USD 2.9m equity gap.
- Discounting at the wrong rate. The present value of debt service uses the loan's all-in rate, not the base rate and not an equity discount rate.
- Applying the cap to the wrong base. Leaving fees and interest during construction out of the funding requirement understates the cap amount.
- Hard-coding the debt amount. A pasted number breaks the loop quietly and goes stale when costs or CFADS change.
- Sculpting past the maturity date. CFADS after the final repayment date cannot support senior debt, even though the PPA runs to year 20.
- Testing on the wrong period length. Sizing on annual totals can hide a weak six-month period when the term sheet tests each period.
Frequently asked questions
What is the difference between debt sizing and debt sculpting?
Debt sizing finds the largest debt amount the lender's tests allow. Debt sculpting shapes the repayments so that debt service follows CFADS at a target ratio. Sculpted debt service, discounted at the loan rate, gives the DSCR-based debt size, so the two are usually built together.
Does a lower sizing DSCR always mean more debt?
A lower ratio raises the DSCR limit in inverse proportion, but only until the gearing cap takes over. In the example, 1.20x allows USD 27.2m, still USD 0.8m under the cap. Below about 1.16x the cap binds and a lower ratio adds almost nothing.
Is the lender's case always P90?
No. Practice varies between lenders and markets, and some term sheets test two yield cases with two ratios. The term sheet defines the case, so take it from there and not from habit.
Does a higher project cost change the debt amount?
Not when the DSCR binds, because the DSCR limit depends on cash flow and not on cost. If the budget rises before close, the extra cost is funded by equity. When the gearing cap binds, a higher funding requirement raises the cap amount, up to the DSCR limit.
Can debt sizing be modelled without circular references?
Yes. A copy and paste macro can iterate the debt amount until it settles. Where financing costs are a fixed share of debt, the answer can also be solved with algebra, as shown above.
Sources
Pages opened on 4 October 2026 and checked again on 5 October 2026. The example project is invented and has no source.
- Project Finance Transactions and Debt Sizing Versus Debt Sculpting, Forvis Mazars Financial Modelling. Used for the definitions of debt sizing and sculpting, the principal formula and the point that sculpting improves debt carrying capacity.
- Debt Service Coverage Ratio (DSCR): formula, meaning and use in project finance, Forvis Mazars Financial Modelling. Used for the statement that a debt service period is typically a quarter or a half-year.
- Debt Sizing with Target DSCR: Project Finance, Renewables Valuation Institute. Used for debt service as quarterly CFADS divided by the target DSCR and for the VBA macro approach to the iteration.
- P50 vs. P99 in Project Finance: How Lenders Size Debt, Renewables Valuation Institute. Used for the dual yield case test, its general examples of 1.30x on P50 and 1.00x on P99, its case study pairing of 1.20x and 1.00x, and the rule that the lower amount binds.
- Debt Sizing Philosophy and Debt/Cap vs DSCR, Edward Bodmer. Used for the two constraints, the "skin in the game" and "believing a forecast" philosophies, and the conditions that make the DSCR more likely to bind.
- Debt Sizing and Cost Padding with Debt/Capital Constraint, Edward Bodmer. Used for the factors that make the debt to capital limit bind, the cost padding incentive and the lower ratio on P90 or P99 cases for wind farms.
- P50/P90 Analysis for Solar Energy Systems Using the System Advisor Model: Preprint, National Renewable Energy Laboratory, record on OSTI.GOV. Used for P50 and P90 as exceedance probabilities and their role in financing.
- Utility-Scale Solar Photovoltaic Power Plants: A Project Developer's Guide, International Finance Corporation. Used for the statements that investors most often require a P90 energy yield and that financing typically has at least 30 percent equity.