Lending to a multi-offtaker solar project: how lenders assess an aggregated portfolio
By SolarQuant Editorial. Published 2026-10-05. Last updated 2026-10-05.
Most term sheet guides assume one offtaker. When a solar project sells to several corporate buyers, or to an aggregator or trader that resells the power, the lender analyses a portfolio of contracts. The model then needs a row per offtaker, a lender's case haircut and a test for losing the largest buyer.
Why does a lender treat several offtakers as a portfolio?
A lender treats several offtakers as a portfolio because the loan is repaid from the pooled revenue of all the contracts. No single buyer's credit decides the loan, so the lender judges the mix: who pays, how much each pays, and for how long.
Public notes describe two structures. Several buyers sign near-identical contracts for shares of one project's output, or one buyer signs a single contract and resells to others (Norton Rose Fulbright). When one buyer defaults, the others keep paying, but buyers will rarely accept liability for each other.
An aggregator or trader changes the question again. A South African bank's note says aggregators usually have no substantial balance sheet, so their business model becomes key. It says aggregators should give financiers insight into both the generation and the offtake portfolios (Nedbank CIB).
This article varies the series example. The 40 MWp plant and the year 1 revenue of USD 5.6m stay the same. The single offtaker is replaced by five invented offtakers.
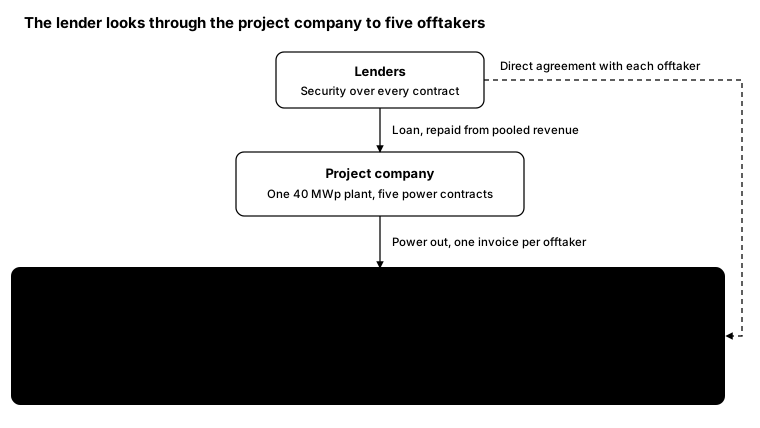
In our reading, the lenders take security over every contract and sign a direct agreement with each offtaker. A training paper says a direct agreement gives lenders notice of a project company default and the right to intervene before termination (CLDP). Each offtaker posts its own payment security and is tested as part of the whole.
How do lenders measure the credit quality of an offtaker portfolio?
Lenders grade each offtaker, then weight the grades by each offtaker's share of revenue. The result is one portfolio measure, read alongside the share of revenue at each grade.
A buyers' association describes the practice for aggregated deals. Developers analyse each offtaker and give the group a common credit rating, and some have used a weighted average (CEBA). We found no public formula from a rating agency, so the method below is our reading.
The table is the input sheet for the example. Every figure in it is invented. Volumes add up to 70 GWh a year, which assumes an invented yield of 1,750 kWh per kWp.
| Offtaker | Volume (GWh a year) | Tariff (USD per MWh) | Credit grade | Contract ends (end of year) | Payment security | Security (months of invoices) |
|---|---|---|---|---|---|---|
| Offtaker 1 | 26 | 75 | A | 15 | Bank guarantee | 2 |
| Offtaker 2 | 17 | 80 | B | 10 | Letter of credit | 3 |
| Offtaker 3 | 12 | 84 | B | 12 | Bank guarantee | 3 |
| Offtaker 4 | 8 | 85 | C | 7 | Cash deposit | 4 |
| Offtaker 5 | 7 | 86 | C | 5 | Cash deposit | 4 |
Volume times tariff gives year 1 revenue of USD 5.6m, the same as the single-offtaker example. Grades A, B and C are an invented internal scale, scored 1, 2 and 3.
The example. The revenue-weighted score is 1.88, a little better than grade B. Grade A earns 34.8% of revenue, grade B 42.3% and grade C 22.9%.
What is a concentration limit?
A concentration limit caps the share of revenue that may come from one offtaker, one credit grade or one sector. It stops a portfolio from behaving like a single-offtaker deal in disguise.
The example. We found no public source for typical limit levels, so the limits here are invented. Assume a limit of 40% of revenue from any one offtaker and 25% from grade C offtakers. Offtaker 1 earns 34.8% and grade C earns 22.9%, so both tests pass.
What it changes in the model. The limit links to cover ratio headroom. In year 1 the example has cash flow available for debt service (CFADS) of USD 4.2m and debt service of USD 3.231m. Revenue can fall 5.8% before the 1.20x lock-up and 11.5% before the 1.10x default, if costs and tax stay fixed.
So any offtaker with more than 11.5% of revenue can take the project to default level if it leaves unreplaced. That is our reading of why lenders pair a concentration limit with replacement rules. The ratio levels are explained in the article "The cover ratio ladder".
How does the remaining contract life compare with the loan tenor?
The weighted average remaining contract life is the average number of contract years left, weighted by each offtaker's share of revenue. In our reading, lenders compare it with the loan tenor to see whether contracted revenue outlasts the debt.
What the term sheet typically says. A business council guide says contracts for new projects often need a duration that covers at least the debt term (WBCSD). A law firm and advisory paper says a smaller buyer may negotiate a shorter contract if the majority offtaker finances most of the project (Baker McKenzie and Schneider Electric). The bank note on aggregators lists the weighted-average life of offtake agreements among its key measures.
The example. The five contracts have a weighted average remaining life of 11.2 years. The loan runs for 12 years, and its average life, weighted by principal repaid, is 7.2 years. Which of the two the lender tests against varies by deal.
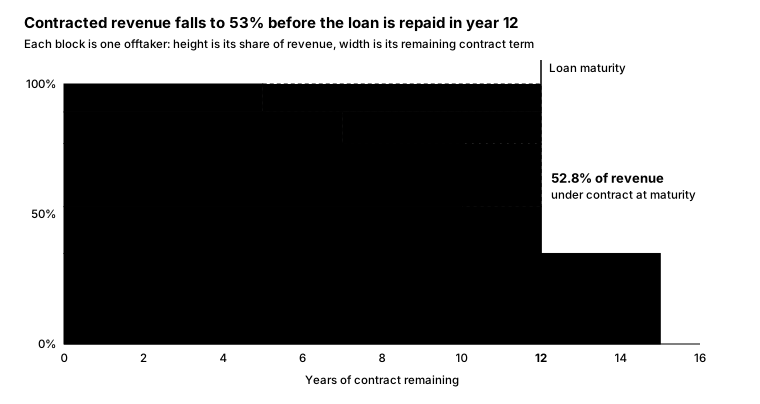
Three contracts end before the loan does, and Offtaker 2 is the one that matters most. An average of 11.2 years looks close to 12, but it hides a drop in the last two years of the loan.
How much of the output must be under contract?
The contracted share is the part of forecast revenue, in a given year, that is covered by a signed contract with an accepted offtaker. Lenders test it year by year, because uncontracted output earns an uncertain price.
What the term sheet typically says. A rating methodology ranks merchant sales as the least favourable revenue for a renewable project (CareEdge Global). A term sheet can therefore set a minimum contracted share, a haircut on uncontracted revenue, or both. We found no public source for typical levels.
The example. Assume an invented minimum contracted share of 70% in every year of the loan. The portfolio is fully contracted in years 1 to 5 and stays above 70% until year 10. In years 11 and 12 it holds 52.8%, so the test fails unless Offtaker 2 renews or is replaced.
What changes when the buyer is an aggregator or trader?
When an aggregator or trader buys the output and resells it, the lender also tests whether the aggregator's own customers need the power. The demand cover ratio is contracted end-customer demand divided by the supply the aggregator has committed to buy.
The bank note describes the logic. Aggregators usually offer a mix of long and short offtake options, and may hold more demand than supply so that demand always exceeds supply. It does not publish a ratio.
The example. Suppose one aggregator bought all 70 GWh and held end-customer contracts for 84 GWh a year. Demand cover is 1.20x, against an invented minimum of 1.10x. Both the 84 GWh and the 1.10x are invented.
The common mistake. Testing demand cover once. End-customer contracts can be shorter than the aggregator's purchase contract, so the ratio needs its own row for every year of the loan.
What payment security does each offtaker give?
Payment security is a bank guarantee, letter of credit, parent guarantee or cash deposit that the project calls when an offtaker fails to pay. In a multi-offtaker deal each offtaker posts its own. In our reading, the amount follows its credit.
A PPA software provider defines the instruments (Pexapark). Under a bank guarantee or letter of credit, a bank pays if the buyer does not. A parent company guarantee puts a stronger parent behind a weak or unrated buyer, and cash in an escrow account is an alternative.
The buyers' association note says each offtaker in an aggregated deal signs its own contract and posts its own credit, commensurate with its rating. A training paper on power project finance lists escrow accounts and a liquidity letter of credit as forms of liquidity support (CLDP).
The example. The input table sets security at 2 months of invoices for grade A, 3 for grade B and 4 for grade C. That totals USD 1.34m, or 2.9 months of portfolio revenue. The month counts are invented.
What it changes in the model. Security is a backstop, not revenue. It covers unpaid invoices while a contract is ended and the volume is resold. Our reading is that it should span the credit period, 60 days in the example, plus the time needed to terminate.
What happens when an offtaker leaves?
When an offtaker defaults or its contract ends, the project must resell that volume to a replacement the lender accepts. Until it does, the lender treats the volume as uncontracted and tests whether the remaining offtakers can carry the debt.
What the term sheet typically says. Public sources describe the pieces, not a standard clause. A law firm and advisory paper lists a tripartite agreement with each buyer among project financing requirements (Baker McKenzie and Schneider Electric). In our reading, a buyer's right to transfer its share to another buyer also affects bankability.
In our reading, a replacement clause has four parts. They are a time limit to re-contract, a minimum credit grade, a minimum tariff and fresh payment security. The lender approves any replacement that misses one of them.
The example. Remove each offtaker in turn for a full year, with no replacement. Costs and tax are held at the series figures, which is a simplification. A full model recalculates tax, which softens the fall.
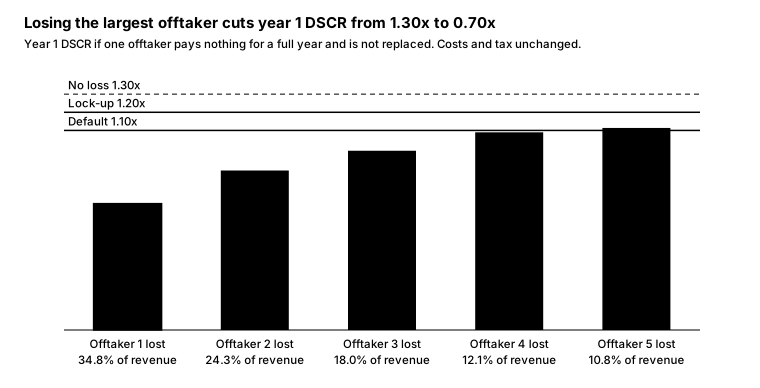
Losing any one offtaker takes the ratio below the 1.20x lock-up, and only the loss of Offtaker 5 stays above the 1.10x default. Diversification limits the damage, but a loan sized at 1.30x has little room for a year of lost revenue.
If Offtaker 1 is replaced at once at 85% of its tariff, the ratio is 1.21x. With a six-month gap first, it is 0.95x for that year. The 85% and the six months are invented.
What does the lender want reported on the portfolio?
The lender wants a regular portfolio report on each offtaker's volume, payments, credit grade and security, plus the portfolio tests. The bank note on aggregators says they should give financiers insight into the offtake portfolio. We found no public template, so the list below is our reading.
- Per offtaker: volume delivered, amount invoiced, amount received and days outstanding.
- Credit: current grade and any change since the last report.
- Security: instrument, amount, issuing bank and expiry date.
- Contracts: end dates, notices of default or termination, and any replacement signed.
- Portfolio tests: largest offtaker share, share by grade, weighted average remaining life and contracted share by year.
- Aggregator deals: end-customer demand, committed supply and the demand cover ratio.
How do you model it?
Model a multi-offtaker project with one input row per offtaker and one set of portfolio tests per period. The debt, reserve and cover ratio sheets stay as described in "How to read a solar project finance term sheet: a modeller's guide".
- Build the offtaker table. One row each for volume, tariff, credit grade, contract end date and payment security. The example uses annual periods. Real deals usually use six-month periods.
- Compute revenue per offtaker. Volume times tariff, switched off after the contract end date.
- Add an uncontracted row. It picks up volume freed when a contract ends.
- Apply the lender's case haircut. The example uses invented haircuts of 10% on grade C revenue and 20% on revenue after a contract ends.
- Run the portfolio tests each period. Largest share, share by grade, weighted average remaining life, contracted share and demand cover.
- Size or test the debt on haircut CFADS. Hold costs and tax fixed for a first pass.
- Run the loss test. Remove each offtaker in turn, with a replacement gap and a discounted tariff.
- Keep payment security outside CFADS. It is drawn only against unpaid invoices.
The example. The haircut is 2.3% of revenue in years 1 to 5 and rises to 9.4% in years 11 and 12. If the debt stays at USD 25.1m, the ratio is 1.26x in years 1 to 5 and 1.14x in years 11 and 12. That is under the 1.20x lock-up.
Resizing at 1.30x on the haircut CFADS gives debt of USD 23.8m. That is USD 1.25m less than the single-offtaker case, and gearing falls from 62.7% to 59.6%.
What are the common mistakes?
Most of these mistakes model the portfolio as one average buyer, when it is a set of separate contracts that change over time.
- One revenue line. A blended tariff hides contract ends, grades and concentration.
- Averaging by count. Credit and contract life are weighted by revenue. In the example a simple average score is 2.20, against 1.88 weighted.
- Trusting the average. A weighted average remaining life near the loan tenor can hide a late drop in contracted revenue.
- Testing at close only. Concentration, contracted share and demand cover move every period.
- Treating security as credit. A four-month deposit covers four months of arrears, not years of lost revenue.
- Free replacement. The lender's case needs a gap and a discount when an offtaker is lost.
- Assuming cross-cover. Buyers rarely accept liability for each other.
Frequently asked questions
Is a multi-offtaker project easier to finance than a single-offtaker one?
Not automatically. Several buyers spread default risk, and one published view is that lenders may like that diversification if little or no revenue comes from weak credits. The lender also takes on more analysis, shorter contracts and replacement risk.
Do the offtakers guarantee each other?
Usually not. The law firm note we opened says buyers will rarely agree to assume liability for other buyers. Each contract stands alone, so the model should treat each offtaker's default separately.
What is a demand cover ratio?
A demand cover ratio compares an aggregator's contracted end-customer demand with the supply it has committed to buy. A ratio above 1.00x means customers have contracted for more power than the aggregator must take. The 1.10x minimum in this article is invented.
Why does the loss of one small offtaker breach lock-up?
Because the debt is sized with a 1.30x ratio, which leaves limited headroom. In the example, year 1 revenue can fall only 5.8% before the ratio reaches 1.20x. The smallest offtaker earns 10.8% of revenue.
Sources
Pages opened on 4 October 2026 and checked again on 5 October 2026. The example project is invented and has no source.
- Aggregated PPAs, Norton Rose Fulbright, Project Finance NewsWire, April 2021. Used for the two aggregation structures, the effect of one buyer's default, buyers rarely accepting liability for each other, and lenders' view of diversification.
- Solving Offtaker Credit Barriers through Aggregation, Corporate Energy Buyers Association (CEBA), April 2024. Used for a common group credit rating by weighted average and each offtaker posting its own credit.
- Energy aggregators are paving the way for a liberalised electricity market in South Africa, Nedbank CIB. Used for how financiers view aggregators in South Africa: business model, insight into the portfolios, customer diversification, weighted-average life of offtake agreements, credit quality and demand exceeding supply.
- CareEdge Global Project Finance Rating Methodology, CareEdge Global, March 2026. Used for merchant sales ranked as the least favourable revenue.
- What is a corporate renewable Power Purchase Agreement?, WBCSD. Used for contract duration covering at least the debt term on new projects.
- Corporate Renewable PPAs: The Collaborative Model, Schneider Electric and Baker McKenzie, November 2018. Used for the tripartite agreement with each buyer, and for a shorter contract for a smaller buyer.
- Credit Support Definitions, Pexapark User Manual. Used for the definitions of bank guarantee, letter of credit, parent company guarantee and cash in escrow.
- Financing of Power Projects, U.S. Department of Commerce, Commercial Law Development Program. Used for escrow accounts and a liquidity letter of credit as liquidity support, and for what a direct agreement gives lenders.